AI Recommends You, But the Sale Lands Elsewhere: AI Shopping-Card Leakage and the Underestimated Value of GEO
By GEOly AI | Data: AI-answer monitoring of 1.6M ChatGPT shopping cards + 3.07M in-card offers (US, 2026-05-22 – 06-26)
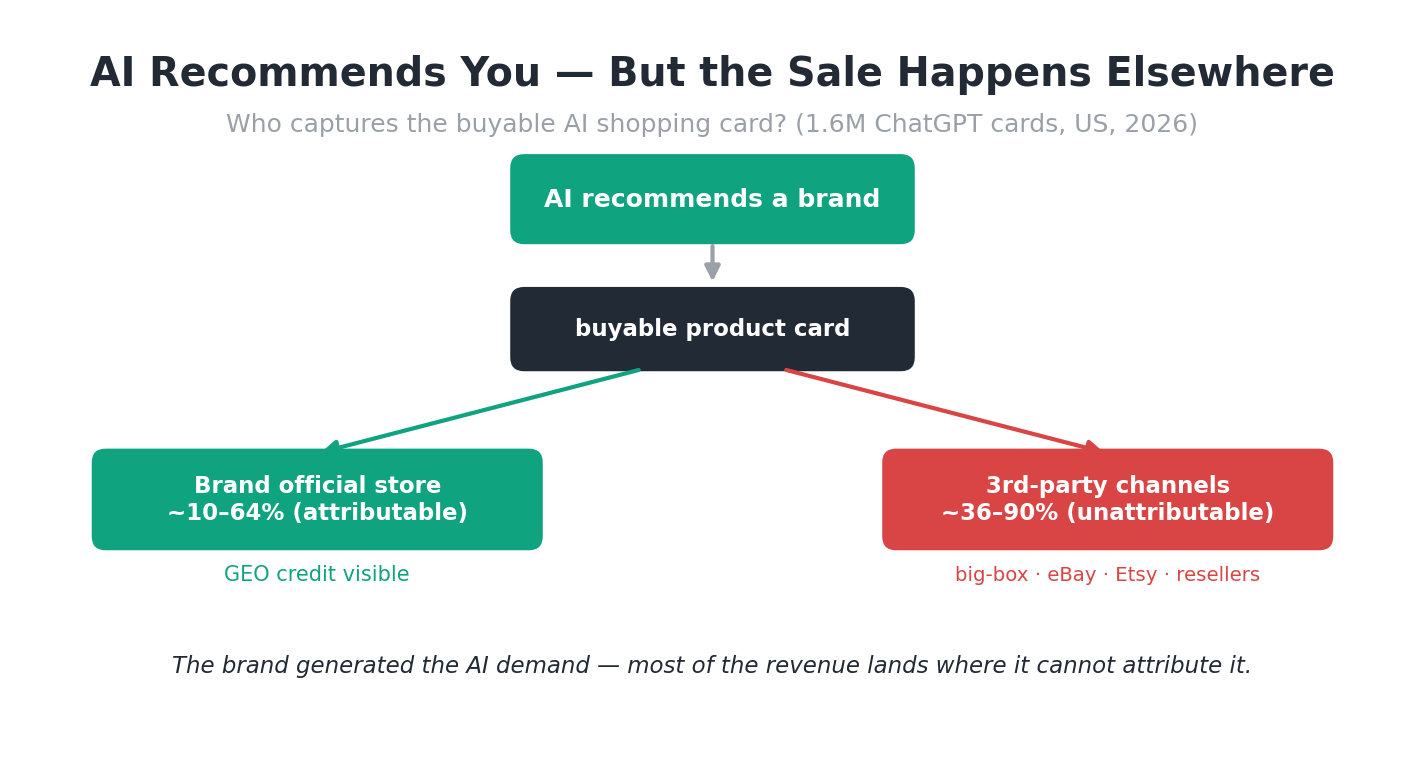
When AI recommends a brand and pops up a buyable product card, where does the “Buy” button actually send the user — the brand’s own store, or Walmart, Best Buy, eBay, Etsy, a reseller? This decides a badly overlooked question: how much of the revenue created by AI (GEO) can the brand actually see, attribute and count toward ROI? We dug into 1.6M ChatGPT shopping cards. The answer: most of it is invisible.
1. TL;DR
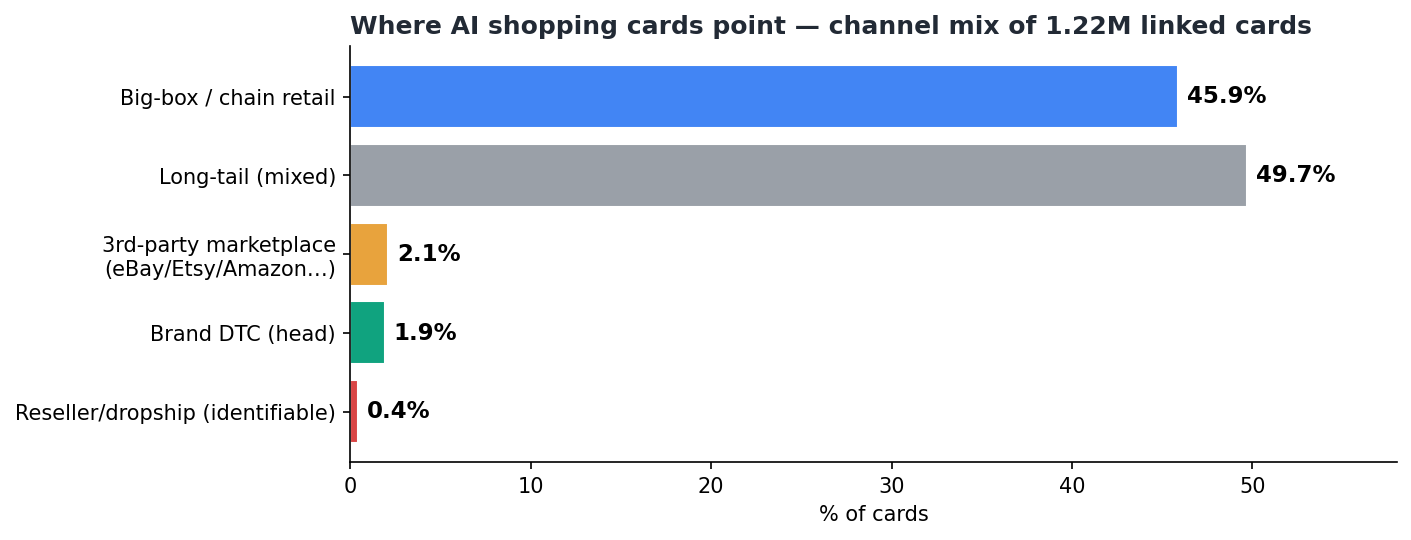
- Brand-owned stores are a minority on the AI shelf: of all cards, only 1.9% clearly map to top brand official sites, while big-box/chain retail takes 45.9%, third-party marketplaces 2.1%, identifiable resellers/dropship 0.4%, and the remaining 49.7% is a long-tail mix (small retailers + brand sites + distributors).
- Per brand it’s worse: a brand’s own cards link to its own store only ~¼–⅔ of the time — Ring just 11%, Anker 27%, eufy 32%, Dyson 36%, Apple 40%; even Bose 64% and soundcore 62% leak a third.
- Amazon “vanishes” from the ChatGPT shelf (0 cards), Temu/AliExpress ≈ 0; but eBay is the #5 seller at the offer level (4.4%, 118K offers) and resale marketplace Poshmark shows up too — a reshuffling of shelf power.
- ~1.9 sellers per card on average: even when the brand store wins the main slot, Walmart/eBay sit right beside it with competing offers.
- Bottom line: most of the demand AI (GEO) creates converts on third-party channels the brand can’t attribute. Combined with AI traffic being hard to track at all, GEO’s true revenue contribution is systematically and severely underestimated.
2. Macro: Where AI Cards’ “Buy” Links Point
Classifying 1.22M linked cards by channel type:
| Channel type | Share | Notes |
|---|---|---|
| Big-box / chain retail | 45.9% | Walmart (14.2%), Home Depot (5.9%), Target (4.9%), Best Buy (3.9%), Lowe’s, Wayfair, Nordstrom, Ulta… |
| Long-tail mix (small retail / brand / distributor) | 49.7% | A 57K-domain tail — some brand sites + many small retailers/resellers |
| Third-party marketplace | 2.1% | Etsy (1.4%), eBay (0.6%); Amazon = 0, Temu/AliExpress ≈ 0 |
| Brand DTC (head) | 1.9% | apple/sony/bose/nike/eufy/anker/ring… combined |
| Reseller/dropship/aggregator (identifiable) | 0.4% | gearmusthave, pzdeals, *.shop … |
Two counter-intuitive points:
- Amazon is not on the ChatGPT shelf (0 cards). ChatGPT’s products come from retailer/Shopify/Etsy feed ecosystems, and Amazon isn’t one — a structural reshuffle where Walmart/Target/Best Buy + Shopify brands replace Amazon as the AI-shelf protagonists.
- Brand official share is tiny. Top brand sites are just 1.9%; even counting long-tail brand sites, a brand’s own attributable channel is a clear minority on the AI shelf.
3. Micro: How Much of a Brand’s Own Cards Link to Itself
Macro shares get diluted, so look per brand: of a brand’s own product cards, what % link to its own store (= attributable); the rest are intercepted.
| Brand | Official capture | Intercepted by 3rd parties |
|---|---|---|
| Ring | 11.1% | 88.9% |
| Anker | 27.1% | 72.9% |
| eufy | 31.7% | 68.3% |
| Dyson | 35.9% | 64.1% |
| Apple | 40.3% | 59.7% |
| Garmin | 51.0% | 49.0% |
| Sony | 51.5% | 48.5% |
| Nike | 57.3% | 42.7% |
| Logitech | 57.9% | 42.1% |
| soundcore | 62.2% | 37.8% |
| Bose | 64.1% | 35.9% |
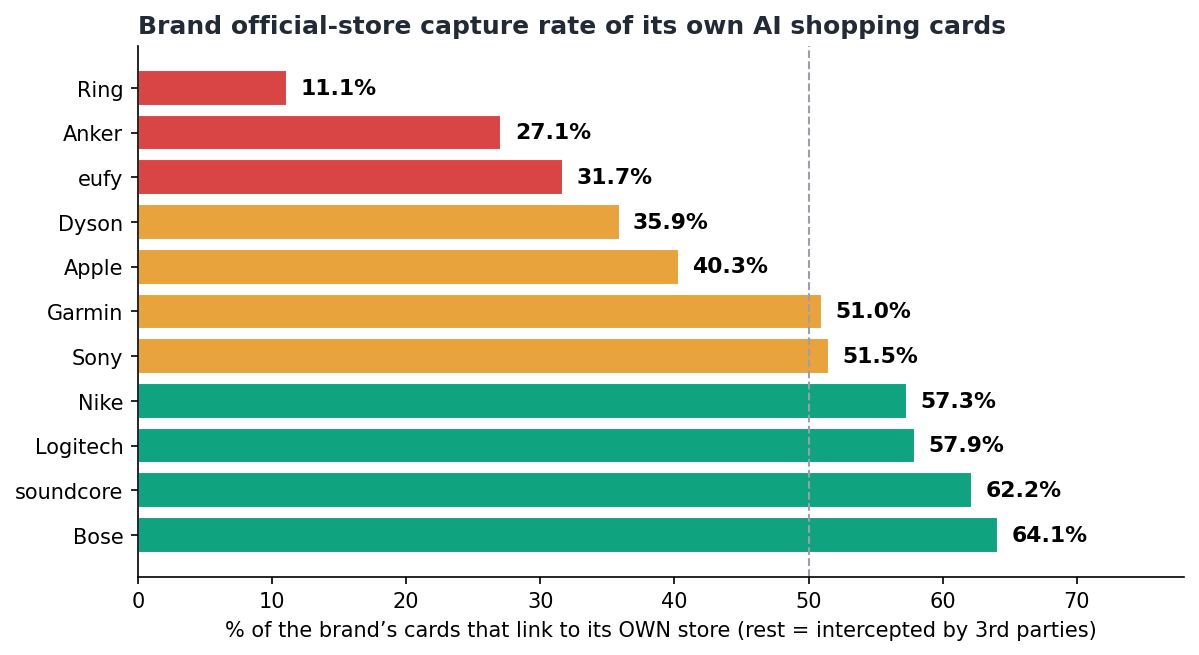
Even DTC-strong brands leak over a third of their AI cards to third parties; retail/Amazon-led brands (Ring/Anker/eufy/Dyson) lose 65–90%.
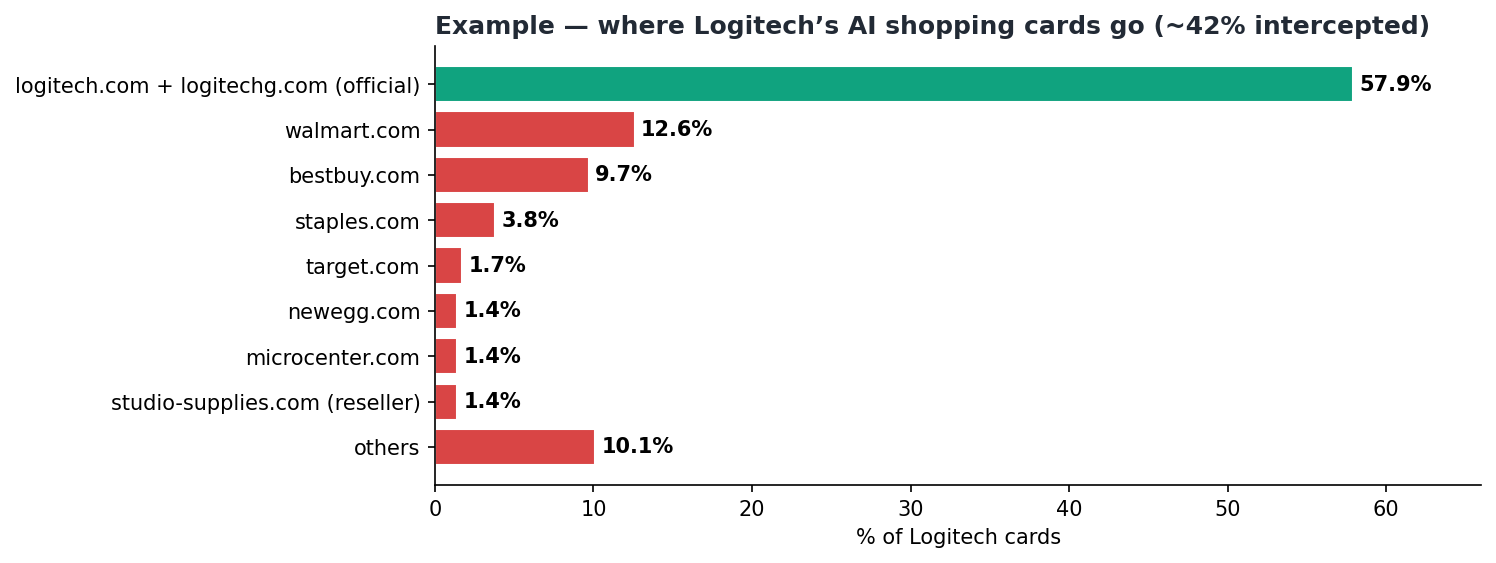
Example: where Logitech’s cards actually go
- Official (logitech.com 27.8% + gaming site logitechg.com 30.1%) = 57.9% — Logitech runs two official domains, so any analysis must count all of a brand’s own domains, or it will undercount the official capture rate.
- Walmart 12.6% | Best Buy 9.7% | Staples 3.8% | Target 1.7% | Newegg 1.4% | Micro Center 1.4% | studio-supplies.com (reseller) 1.4% | rest ~10%
- Even Logitech, with a relatively high capture rate, still has ≈42% of its AI cards converting on channels it can’t directly attribute.
4. A Second Layer of Leakage: Side-by-Side Offers
A card usually carries more than one seller: 3.07M offers / 1.6M cards = ~1.9 sellers/card. Top in-card offer sellers: Walmart 9.2%, Target 5.7%, Best Buy 5.0%, Home Depot 4.4%, eBay 4.4%, Lowe’s, Ulta, Nordstrom… plus resale marketplace Poshmark.
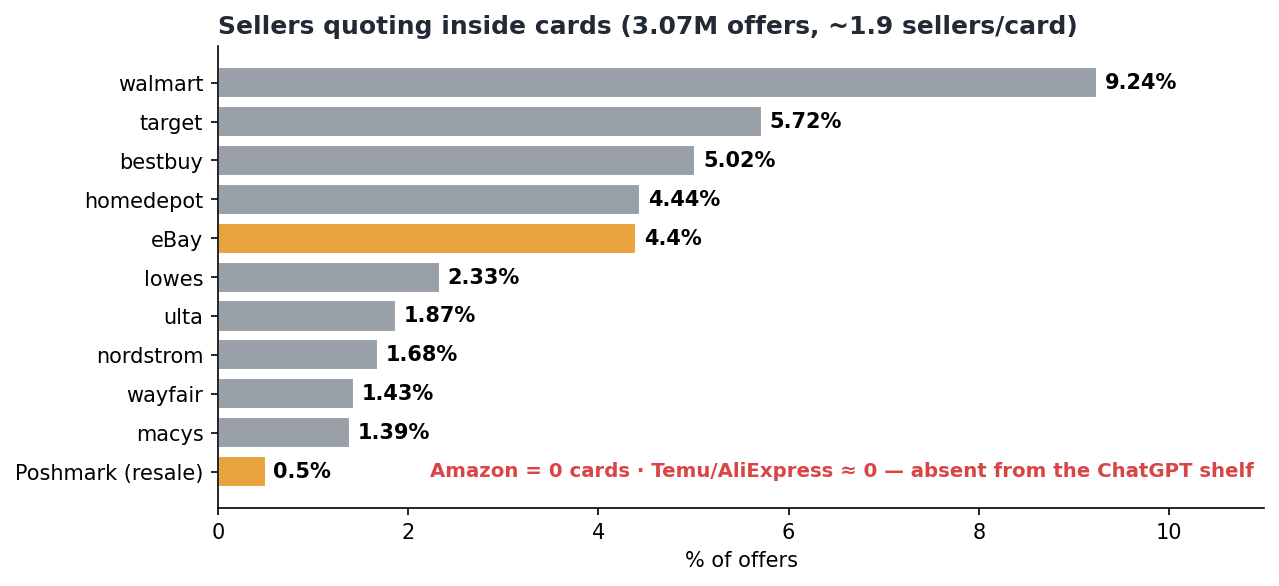
Meaning: even when the brand store wins the main slot, AI lists Walmart/eBay and other cheaper/more familiar sellers right beside it. eBay’s offer-level penetration (incl. used/third-party sellers) is especially notable — it creates no demand yet harvests AI-generated traffic.
5. The Core Argument: GEO Revenue Is Badly Underestimated
Stack the layers and you see why GEO’s true contribution is systematically underestimated:
Brand does GEO → AI recommends the brand (demand created)
   │
   ├─ Only ~10–64% of buyable cards link to the brand store … and of those, only ~30–40%
   │        of AI referrals are even trackable in GA4 (AI apps strip the referrer)
   │        → pure-headless sites may have no native attribution at all
   └─ ~36–90% of buyable cards link to Walmart/BestBuy/eBay/Etsy/distributors
            → the sale happens at a third party; the brand's GA4 never sees it as AI/GEO-driven
A triple funnel: ① low official capture (most flows to third parties) × ② only 30–40% of on-site AI traffic is trackable × ③ zero attribution for third-party sales → what the brand “sees” as GEO orders may be a small fraction of true AI-influenced sales (roughly single digits to ~20%).
Consequence: GEO’s ROI looks far worse on paper → budget gets cut → you hand the AI shelf and mindshare to competitors and retailers. You think GEO drove no orders — actually the orders were captured by channels you can’t see.
6. How to Optimize (Win Back the Invisible Sales + Measure Them)
- Reclaim official shelf position (raise official capture rate): fill out core-SKU product feeds / Catalog (title/price/availability/structured data/use-case tags), connect Shopify Catalog / Agentic Storefronts and platform merchant programs so recommended SKUs surface your official buyable card first — the most direct way to claw back intercepted share.
- Govern resellers + side-by-side retail offers: audit unauthorized resellers (*.shop / aggregators); for authorized retail, push for official-card priority and price consistency to reduce in-card leakage to cheaper/used (eBay/Poshmark) offers.
- Build full-funnel AI→sale attribution to recover the underestimate:
- On-site: GA4 custom channel group (
chatgpt|openai|perplexity|gemini|copilot|claude|…) + outbound UTM + form self-report; - Off-site / headless: source ID → Cart Attribute tagging → Admin API/ShopifyQL → Measurement Protocol back into the warehouse;
- Cross-channel: for retail/marketplace, model indirect attribution via AI shelf-presence × channel sell-through to estimate the AI-driven sales leaking to third parties, and fold it into GEO ROI.
- On-site: GA4 custom channel group (
- Diagnose AI shelves separately: “on the ChatGPT shelf” ≠ “on the Google AI Mode shelf” ≠ “correctly ingested in retailer feeds” — diagnose and run them separately (see the sister piece, “Where Do AI Shopping Cards Get Their Data?”).
- Adopt “official capture rate” as a new KPI: put “official buyable-card presence / capture rate” on the monthly dashboard and steadily raise it — it measures both attributable-sales share and the reclaimable upside.
Method & Scope
- Based on large-scale, link- and offer-level analysis of shopping cards inside AI answers (1.6M ChatGPT cards, 3.07M offers, US, 2026-05-22–06-26).
- “Official capture rate” = share of a brand’s cards whose link domain belongs to the brand’s own domain (incl. regional subdomains); matched per brand by card title — a robust estimate, not per-SKU exact attribution.
- Channel buckets use manual classification of head domains + long-tail merge; “third-party interception” = any non-brand-owned buyable card/offer.
- Boundary: actual GMV per channel needs recalibration with the brand’s own GA4 + backend + retailer sell-through; this piece is a shelf-position / attribution-structure view, not channel GMV quantification.